- Power Optimizer Tutorial
Introduction
Thank you for purchasing this introductory training CD on the Power Optimizer software offered by Wilson Associates. Power Optimizer is a sophisticated asset allocation program for investment advisors. This software helps analyze, construct and compare investment portfolios using Modern Portfolio Theory. The innovator of Modern Portfolio theory, Harry Markowitz, received a Nobel Prize in Economics for his efforts and Power Optimizer uses this theory in its analysis.
This training is provided as an introduction to the software. This lesson does not get into the details of how Modern Portfolio Theory works. For more information on this topic, please check with your local library or try the Internet and search on Modern Portfolio Theory or Harry Markowitz.
Also, this training assumes the user of the software is familiar with the operating systems of either Microsoft Windows 3.1, Windows 95, Windows 98 and Windows NT. All references used in this training tape will be from Windows 95 or 98. The user must be familiar with conventions such as single CLICKing, double CLICKing, dragging, using the tab button and resizing. All versions of Windows have tutorials that will help you get started in understanding how to use your computer.
Let’s Begin
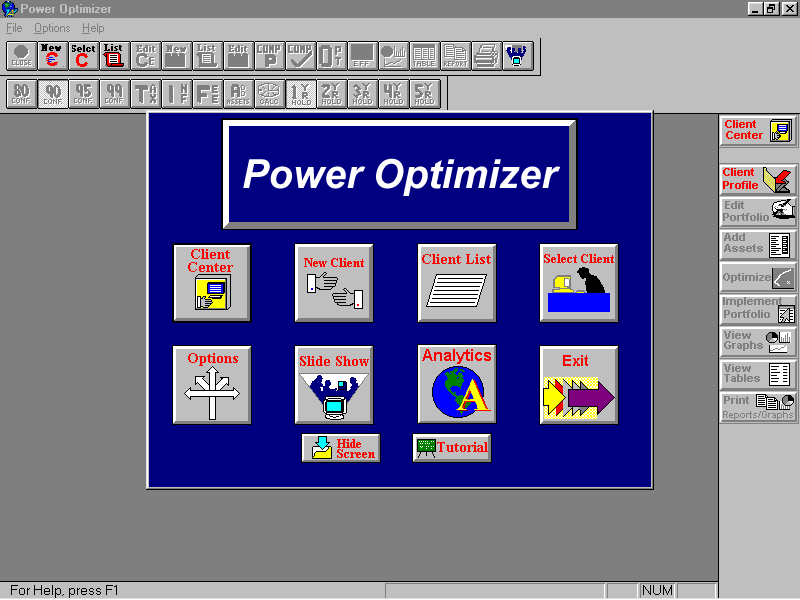
To begin our training, please ensure that the software has been properly loaded. Start the software by double CLICKing on the program icon, Power Optimizer. If you have trouble starting the software, please stop and call Wilson technical support at 818-999-0015.
The main screen should be showing. From this main screen, you can create a new client, select an existing client or start other programs such as the Slide Show, the Client Center or the optional Analytics program.
We will begin, by explaining how Power Optimizer organizes the client information. This organization is important in understanding how data is organized within the program. First, CLICK on the Hide Screen button at the bottom. Now CLICK on the word File at the top left menu. CLICK on the selection Delete/Client/Account /Portfolio.
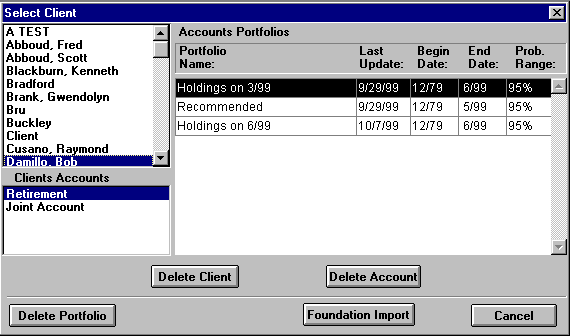
You will notice a window that is divided into three sections. The top left section lists the client’s name. The bottom section lists the client’s accounts. And, the section on the right lists the account’s portfolios. Each client will have at least one account and each account will have at least one portfolio.
The account could be an actual brokerage or mutual fund account or it could be a combination of securities that have the same objective. The portfolio is simply a representation of the account.
If you delete a client, you delete all of the client’s accounts and the account’s portfolios. If you delete an account, you delete all of the portfolios under that account. If you delete a portfolio, then that is all you will delete.
Accounts hold information like Name, Address, Date of Birth and Investment Objectives such as growth, Income, etc. The account also establishes certain defaulted values that will be used when you actually create the portfolio. These values include Tax Rates, Management Fees, Holding Periods, Probability levels (confidence) and Minimum Return requirement.
Portfolios, on the other hand, are where you add securities, establish any estimated returns and determine the investment policy and the actual allocation.
Now, CLICK the Cancel Button.
Software Options and Settings
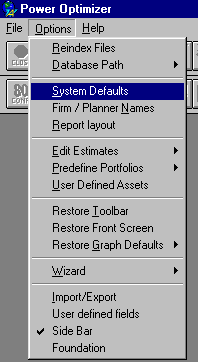
Now we will explore the Options menu. CLICK on the word" Options" at the top of your screen on the menu.
For purposes of this introductory training, we will begin our discussion by CLICKing on System Defaults.
System defaults are defaults that appear every time you create a client account. When an account is created, these are the items that will populate the account. Please remember that these items can be changed on the account for the actual client. System defaults allow you to minimize your data input.
The first item, Income Tax Rate is simply that. When this item is activated, the software will net the portfolio’s ordinary income tax portion of the return from the gross return. It is not necessary to CLICK on the YES box unless you want to automatically tax effect all accounts and portfolios. I would recommend leaving all the YES boxes uncheck here since you can very easily turn these items on and off with the toolbar.
The next item is the Capital Gains rate, which has been lowered by Congress to 20%. The Turnover rate is also a percentage. This is used to tell the software how much of the return, above the yield that is to be taxed at the Capital Gains rate. The management fee is just that. If you are charging asset management fees, enter in the most popular fee you use with your clients. Inflation rate and Risk Free rate should be entered in also. The Risk Free rate is normally the rate of return that an investor can receive with no risk taken. Normally we use the 90-day T-Bill rate here but any other risk free rate can be used.
The Probability Range determines the percentage of the expected returns that will be taken into account in the analysis. This "RANGE" will be used to determine the optimal mix of assets. For example, Portfolio A may have an average return of 10%, but the range of returns at 90% Confidence may be between –3% and 20%. The same portfolio may have a Range of returns at 99% confidence between –10 and 30%. For purposes of this introduction, I would recommend using 95%.
On the "Optimize only for Efficient Portfolios" option; I would recommend leaving it blank. If you would like to view Sharpe Ratios in some of your tables, be sure to check this option.
When you are finished here, please CLICK on the OK button.
Now, CLICK on the Options at the top again.
Select Firm and Planner name. Type in this information, as you want it to appear on the reports. CLICK on the OK button when you are finished.
Now, CLICK on the Options at the top again.
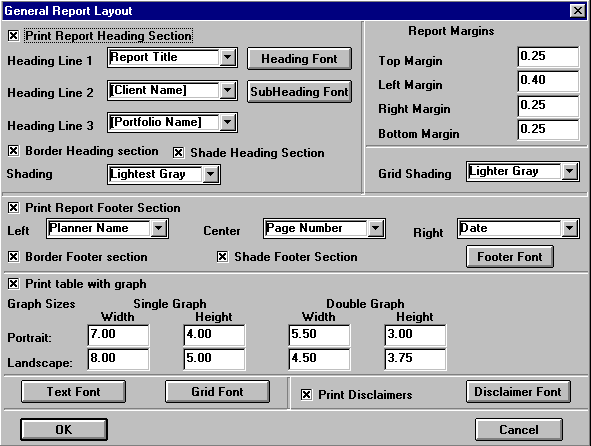
The Report Layout choice allows the user to CUSTOMIZE the report’s headers, footers, fonts and effects. For example, if you want your company’s name to show up on the footer of the report and the date to show at the top, here is where you would customize it. If you are on the Report Layout screen, please CLICK the OK button to save your changes and exit. Otherwise, CLICK on the Cancel button.
I will discuss briefly the remaining items on the Options menu to tell you their function. If you decide to explore these items during this training, you may want to stop or pause the recording and start it up again when you are finished.
Now, CLICK on the options at the top once again and leave it open.
The item, Edit Estimates, allows the user or a participating firm to create estimated returns that can be used in place of historic returns. For example, the historic average return on the Donahue Money Market index is over 7% for the last 30 years. If you would not expect this same return over the next 12 months, you might create an estimate for the next 12 months. Estimating returns is easier for some asset that others but this is a great feature for those that believe the past will not duplicate itself in the next 12 months. Wilson provides historical and estimated returns with your quarterly updates.
The next item is the Predefined Portfolio. Predefined Portfolios are model portfolios that can be created and saved in the software so that the user doesn’t have to recreate them each time. For example, an advisor may have 5 "Model" or Predefined Portfolios. These portfolios may have different objectives and risk parameters. If the advisor wants to SAVE these portfolios to use with any new client, he would enter them here and save time from recreating portfolios for everyone.
The next item under Options is the User Defined Assets. This option allows the user to input data on any security or portfolio that is not already in the software. To enter in data, you must enter the monthly VALUES of the asset or portfolio.
The next three options are self explanatory, but one, Restore Graph Defaults, is one that deserves some explanation. Since the graphs in the software are customizable, a user could end up with a graph that isn’t quite appealing. If you make unwanted modifications to a graph, simply close the graph window and select this option to reestablish the graph’s original settings.
Disregard the wizard option since it is not yet functional.
The Import/Export feature allows the user to import from many third party portfolio management software packages. If you are using Dbcams, Centerpiece, Total Resource or are an LPL rep, you can use this option. Contact your software provider for directions on exporting to this software package.
Now, please CLICK on options at the top and select, Restore Front Screen.
Creating a New Client Account
CLICK the New Client button
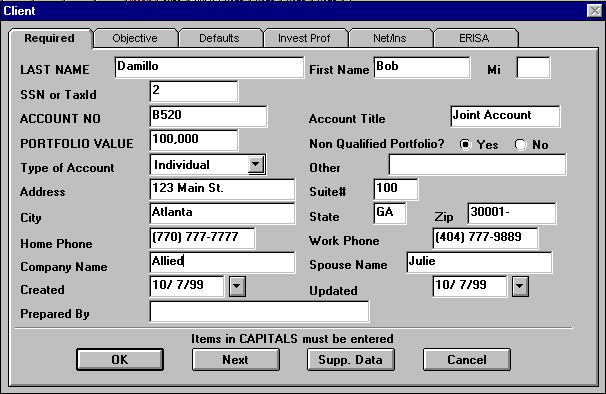
We are now on the Client Account screen. This screen requires certain fields to be entered. The LAST NAME, SOCIAL SECURITY NUMBER, ACCOUNT NUMBER and PORTFOLIO VALUE are required field. Also, I would also highly recommend entering in an Account Title.
For training purposes, enter your last name. Enter the number 2 for Social Security. Enter B520 for Account number. And, enter $100,000 for the portfolio value. For the Account Title, Type "Joint."
As we discussed before, the account could consist of all physical accounts that represent one objective, such as IRA, SEP and 401K. This account might be titled "RETIREMENT". If you are unable to reallocate among accounts, keep them separate. For example, you typically cannot transfer money from the client’s 401k to his personal brokerage account.
The "NON QUALIFIED PORTFOLIO" item will tell the software whether or not the Account is taxable or not. If it is a Qualified Portfolio, you will not be able to tax effect the returns.
We will skip the remainder of this screen since it is not required.
Now CLICK on the Next button at the bottom OR CLICK on the Objectives tab at the top.
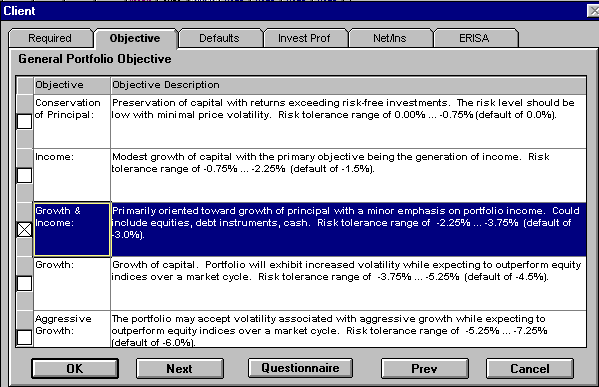
This is the section of the account where you define the investment objective for this pool of money. You can either select the type of investor objective or you can CLICK on the Questionnaire button at the bottom, and answer the questions while letting the software determines the objective.
You will note there are Risk Tolerance ranges for each objective. These Minimum Rates of Return were figured based on 90% confidence. If you are going to use a different confidence level such as 95%, you will need to note it for our discussion on the next screen
CLICK on Growth and Income for this example.
Now, CLICK on the Next button OR CLICK on the Defaults Tab.
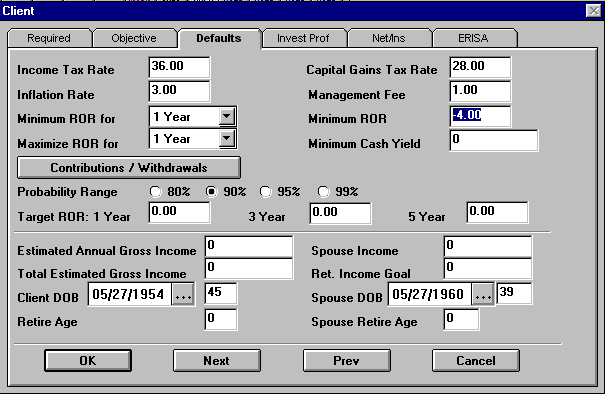
The Defaults tab section is for creating the Client Account Defaults. Some of the information presented here was brought over from the System Defaults we previously discussed under the Options Menu. The main area of interest is the holding period and "Minimum Rate of Return." If your client is concerned about risk over a one-year period (typical) be sure 1 Year is selected.
The Minimum Rate of Return should designate the amount of risk the client is willing to take based on the holding period. If the client could tolerate a 4% loss in a BAD year, enter the amount minus 4. Do this now. This number will help the software "pick" a portfolio on the efficient frontier that does not violate the client’s minimum rate of return requirements.
The Contributions and Withdrawals button allows the user to show varying cash flows into and out of the portfolio. The Targeted Rates of returns are for information only and are not used in any calculations. The remaining fields are for information only, however, the Date of Birth and retirement information is required for one report that calculates future value of retirement needs.
The next three tabs are for information only and only need completion when you are ready to print out a final report.
Entering the Client’s Current Portfolio
Next, CLICK on the OK button.
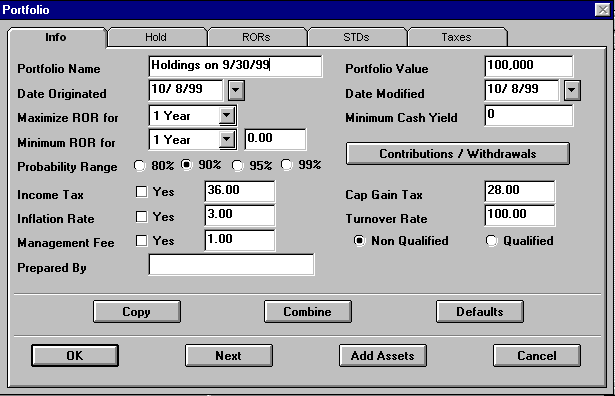
You should now be looking at the Portfolio input screen and the "Info" tab. You will note the information you typed into the Account Defaults Screen is now automatically entered here.
Next, name the portfolio. Portfolio naming conventions might include examples like "Current Holdings", "Charles Schwab 3/31/99" or "Proposed Holdings." Also, you might want to create a portfolio with just one security or index for comparative purposes. For example you might name a portfolio "S&P 500" and include 100% allocation to the S&P’s index.
Name the portfolio "Holdings on 9/30/99" and CLICK the Add Assets button.
The "Building the Portfolio" screen allows you different ways of adding securities to your portfolio. The Select Assets button allows you to pick securities right out of the database. Though this is the fastest way to create portfolios, this option gives you little flexibility.
The "Classify Specific Securities" button allows you to select a specific Mutual Fund or Stock from the database and the software categorizes it into either an asset class or an investment style. Only US Equity Mutual Funds have a style attached to them.
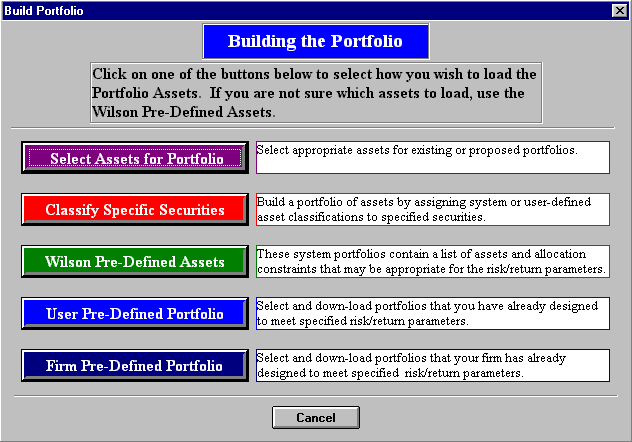
The "Wilson Pre-Defined Assets" button gives you a preset list of assets and constraints that may be appropriate for the risk/return parameters.
The "User defined Portfolio" button allows you to select a model portfolio you have already constructed. The "model" portfolios can be created under the Options menu choice.
The Firm Predefined Portfolio button is only available for Broker Dealer and Investment firms that have provided Wilson with "model" portfolios for their investment representatives.
For purposes of this training, CLICK on the Classify Specific Securities button.
During this training, we will assume we are entering our client’s current portfolio into the software first. We will assume our client owns only two mutual funds. To choose a database, CLICK on the Asset Data button at the top left corner and select Mutual Funds.
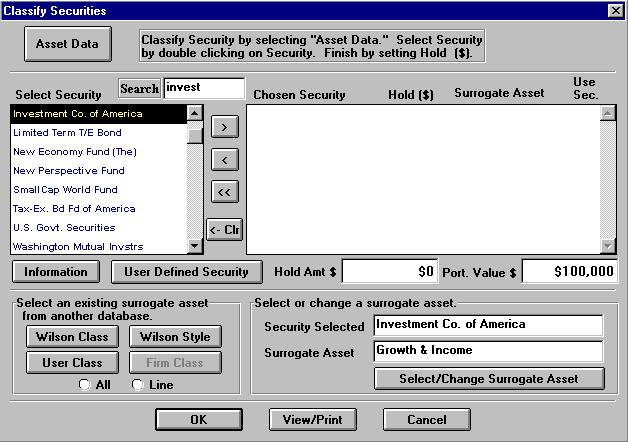
CLICK inside the Search box and type I-N-V-E-S-T. The mutual fund Investment Company of America should be at the top of the box on the left.
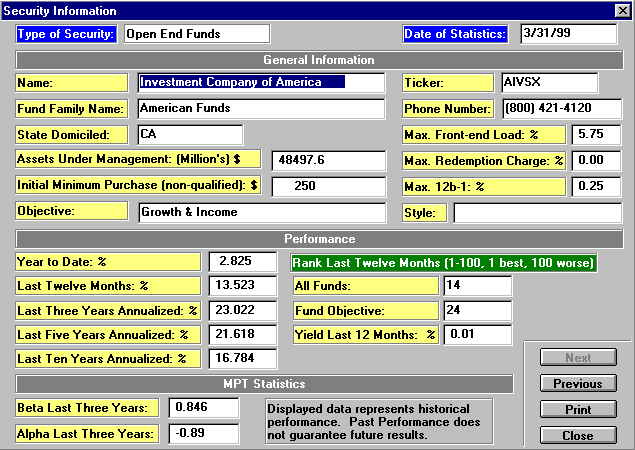
If you are interested in some information on this mutual fund, CLICK one time on the fund. Now CLICK on the Information button. This information is updated quarterly.
Close the Security Information screen with the CLOSE button at the bottom right corner.
To add Investment Company of America to the portfolio, DOUBLE CLICK on the fund or use the arrow pointing to the right. The mutual fund is now on the right side.
You will also notice the fund has been assigned a Surrogate Asset to represent it in the analysis. In this case, the Growth and Income index is defaulted. If you have the optional Mutual Fund database, you will notice a box directly to the right of the Surrogate Asset. This box gives you the option of using the actual security’s historical data in the analysis. For training purposes, we will leave this box blank and use the asset classes history.
Now, CLICK in the Search box again and type BOND. Bond Fund of America should be at the top of your list. Again, DOUBLE CLICK on this fund to select it.
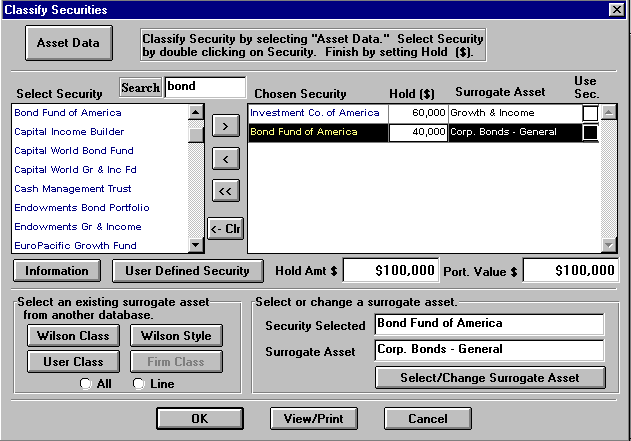
We will now enter the client’s dollar holdings into the software. To do this, CLICK in the box directly to the right of the Chosen Security. For Investment Co., type $60,000. Now, using your arrow keys on your keyboard, CLICK your DOWN arrow key. For Bond Fund, Type $40,000.
The Hold Amount total at the bottom should equal the Portfolio Value to the right. CLICK OK to proceed.
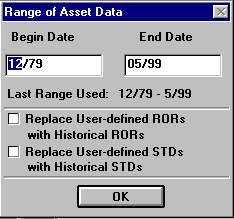
A dialog box titled Range of Asset Data will come up. You have the option of changing the time frame of the historical data you want in your analysis. Change the Begin Date by typing 12/1979. This will cause the software to use historic data from December 31, 1979 to the present.
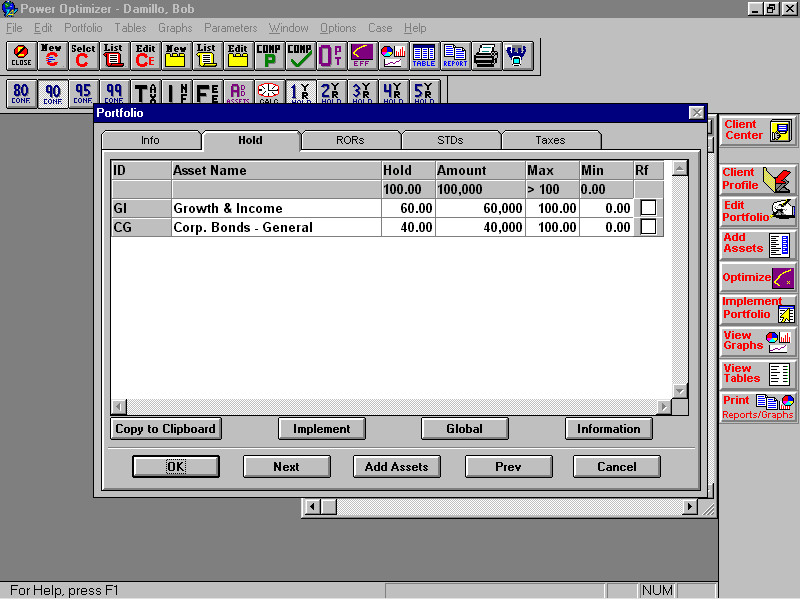
You should be on the Portfolio Info tab. At this point CLICK on the NEXT button. The Hold tab tells you which assets you are using and what Holding Percentages or Dollar Amounts are allocated to the current portfolio’s assets.
CLICK on the Next button and proceed to the ROR tab. The Rate of Return tab shows the historic rolling returns for each asset based on a one through five-year holding period. These returns have been calculated by the software and are average geometric rolling returns. The One-Year returns are calculated by taking a geometric average of every 12-month period from the Begin Date to the End Date.
For example, the return for Growth and Income is determined by calculating the return from 12/79 through 12/80, then from 1/80 through 1/81, then 2/80 through 2/81, etc. Each of these one-year returns is averaged to come up with the Average One-Year Return. Similarly, the Five-year return is determined by calculating the returns from 12/79 through 12/84, then from 1/80 through 1/85, then 2/80 though 2/85. These returns are annualized and averaged geometrically.
If you would like to over-ride these historic returns and use you own estimates or Wilson Estimates, CLICK on the Estimates button and make the appropriate choice. For our training, we will not use estimates but use the defaulted historical returns.
CLICK on the Next button and notice the Standard Deviations for the same holding periods.
CLICK on the Next button to tax effect each asset differently.
CLICK on the OK button.
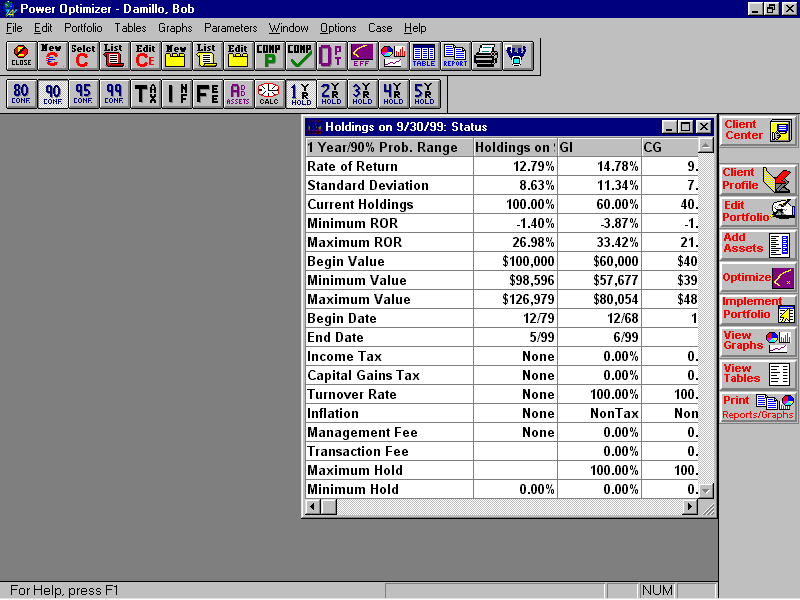
The screen showing is the Portfolio Status screen. This screen shows several stats on the portfolio as a hole and on each asset independently.
To view the portfolio graphically, CLICK on the View Graphs button on the right Side Bar and select the Asset Mix/Pie choice. Now, DOUBLE CLICK on any of the pie slices to view information on each slice.
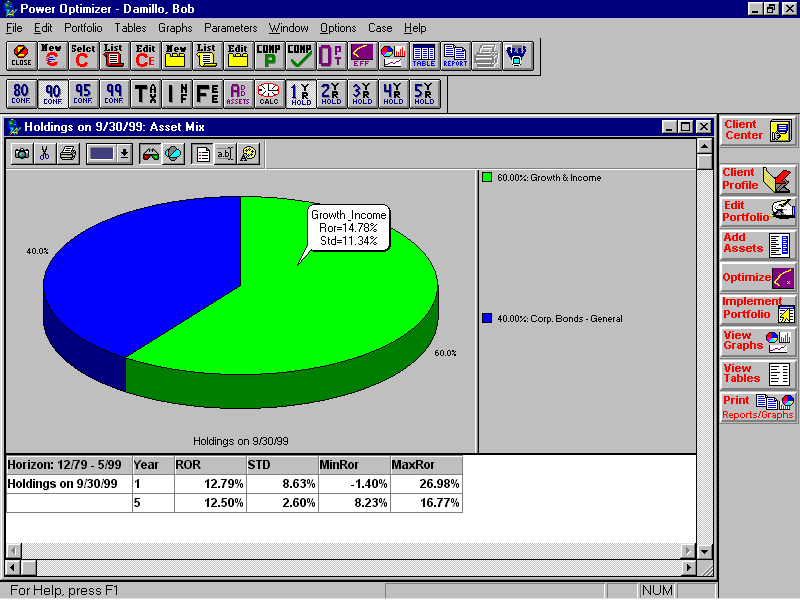
CLOSE this window by CLICKing the X that is directly at the top right of the graph window.
You have completed entering in the client’s current holdings.
Entering the Recommended Portfolio
To enter the Recommended Portfolio, CLICK the YELLOW NEW button on the top tool bar. For the Portfolio Name, type Recommended.
CLICK Add Assets. CLICK Select Assets for Portfolio. For our training purposes, we will use asset classes to build a recommended portfolio. On the Choose Asset Data box, DOUBLE CLICK the Asset Class choice.
The left column lists the asset classes available and they are divided into categories. For example, Mutual Fund indices are located in the Pooled Funds section and the S&P 500 is located in the Domestic Equities section. Note the buttons on the top allow you to move quickly to the Next or Previous section. The scroll bar on the right of the list can also be used to maneuver.
To begin, we must choose the assets we want to use in our recommended portfolio. Begin by selecting the Prime Rate Index by DOUBLE CLICKing on it. Scroll down to the section titled Cash Equivalents. DOUBLE CLICK on the Donoghue Money Mkt. These assets should show up on the right side under Selected Assets. If not, use the Add button at the bottom.
Scroll down on the list until you get to the Pooled Funds section. Under Pooled Funds, find International Equities. Add it to you portfolio by DOUBLE CLICKing or use the Add button.
Scroll down a little farther and find Specialty Financial Services. Add this asset. Also add Specialty Technology.
Now, CLICK on the Next Section button at the top 3 times. You should be on the Domestic Equities section. Scroll down under Domestic Equities until you get to Wilshire Large Co. Growth. Add this asset. Also add Large Co. Value, Small Co. Growth and Small Co. Value.
CLICK on the Next Section button at the top 3 more times. You should be on Domestic Bonds.
Scroll down on Domestic Bonds until you get to Salomon Corporate Bonds 3-7 years. Add this asset. Scroll down to Salomon Treasuries 1-3 years and add this asset.
The next section is International Bonds. Double CLICK on International Bonds under this section.
CLICK on the Next Section button six more times. You should be on the Futures Section. Double CLICK on Futures Pooled Index to add this asset.
You will note all of the Selected Assets are listed on the right side. If you want to remove one, just Double CLICK on the asset at the right.
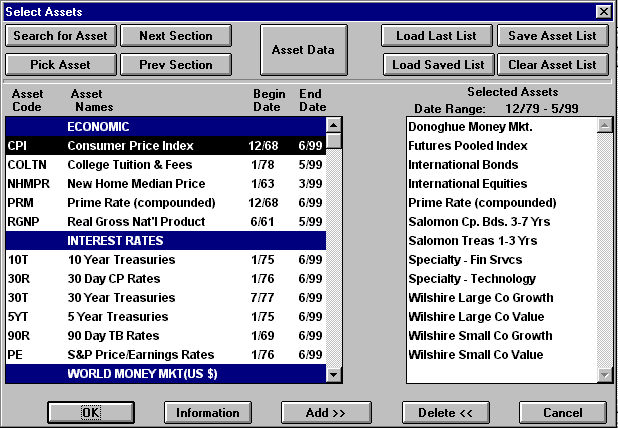
CLICK on the OK button at the bottom.

The Range of Asset Data should show a Begin date of 12/79 and an End Date that is the most recent data date of your software. CLICK OK
The screen you should be looking at is the Portfolio screen. CLICK on the Next Button.
The Hold Tab allows you to modify the Asset Name, add you own asset allocation percentages or dollar holdings and it allows you to establish the investment policy.
Typically the "policy" refers to the Maximum and Minimum you are allowed to invest in each asset. For our purposes, we will assume the client does not want us to have anymore than 20% in cash at any one time. Also assume the client is requiring us to hold at least 5% in cash at all times.
CLICK in the Max box for Donaghue Money Markets. Delete the 100 and type 20. Now, using your keyboard, hit your Right Arrow button until the Minimum Box is highlighted. Again, using you keyboard, type 5. You have established an investment constraint on Cash that does not exceed 20% but requires at least 5%.
Using your arrow keys again, hit the left arrow once and the down arrow once. You should be on Futures Pooled Index. Type 15% for the Max. Hit the down arrow again. For International Bonds, type 10. Continue as follows:
International Equities 20% Max
Prime Rate 15% Max
Salomon Cp. Bds. 3-7 Yrs 20% Max 5% Min
Salomon Treas 1-3 Yrs 20% Max 5% Min
Specialty - Fin Srvcs 5% Max
Specialty – Technology 5% Max
Wilshire Large Co Growth 15% Max
Wilshire Large Co Value 15% Max
Wilshire Small Co Growth 15% Max
Wilshire Small Co Value 15% Max
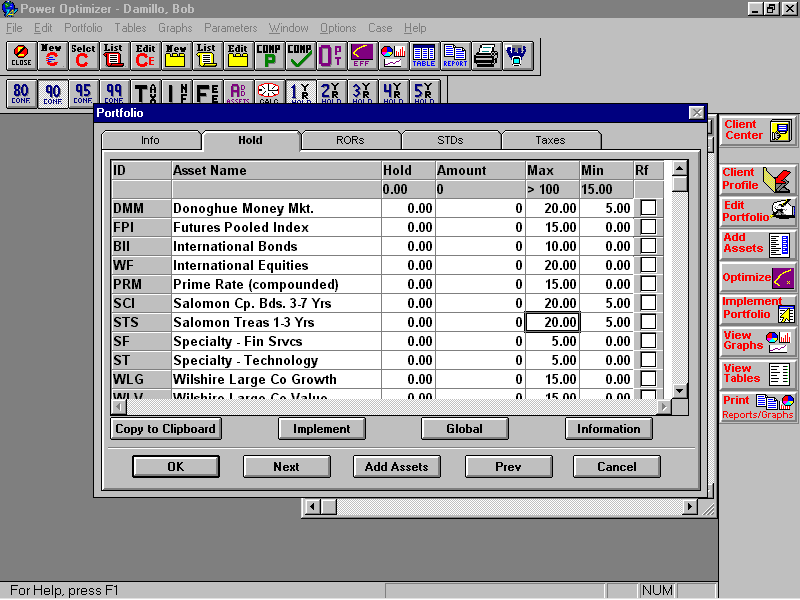
Keep in mind, these are constraints on the portfolio optimization process also. If we simply wanted to allocate a certain percentage or dollar amount to each asset, we would have used the Hold or Amount fields.
Now, CLICK on the OK button.
Next, CLICK on the Optimize button on the right side bar or the OPT button on the top tool bar.
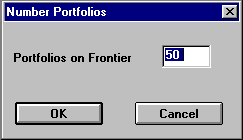
The next dialog box that is presented, asks How many portfolios you would like to have calculated that will make up the efficient frontier. Choose the defaulted 50 by CLICK on the OK button.
The Efficient Frontier
The Efficient Frontier Graph sho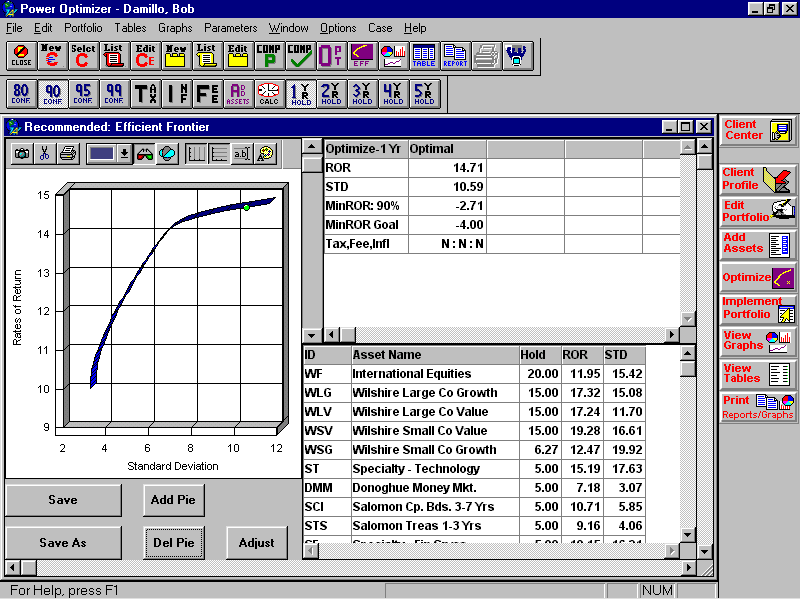 ws the curve representing all 50 portfolios that are historically "efficient" relative to expected return and risk (standard deviation). Power Optimizer chooses the portfolio on the curve that allows the greatest Rate of Return at the most feasible Risk (Standard Deviation). The ball on the curve represents this "optimized" portfolio.
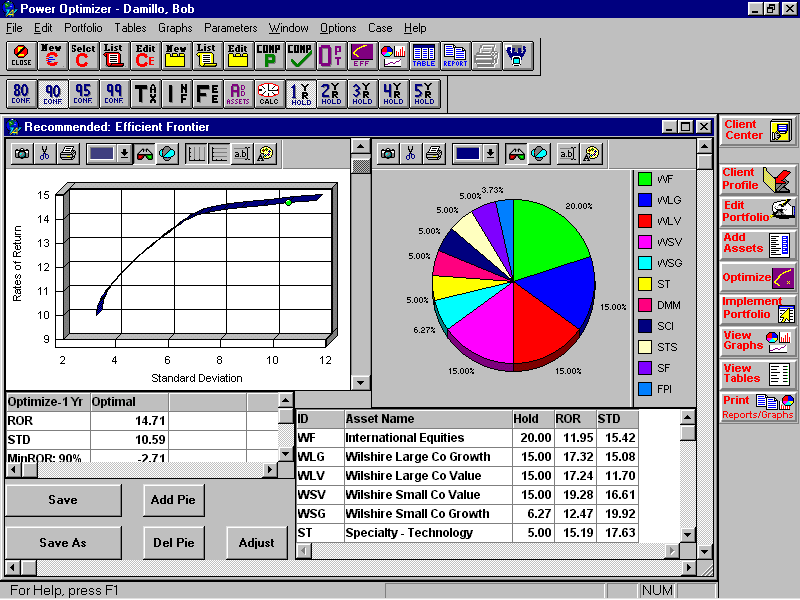
Note the "optimized" portfolio does not violate the client’s Minimum Rate of Return goal (-4%) for our example.
CLICK on the Add Pie button at the bottom left corner.
The pie graphically represents the optimized portfolio.
Note the Scroll Bar directly to the left of the Pie and directly to the right of the efficient frontier.
Scroll down several times by CLICKing on the down arrow. This illustrates dynamically the changing asset mix based on Risk and Return. The farther down the ball is on the efficient frontier, the lower the risk and the lower the expected return.
Comparing Current vs. Proposed
To compare the client’s current portfolio to the efficient frontier of the proposed, CLICK on the COMP P button on the top tool bar. Choose the client’s current portfolio by DOUBLE CLICKing on the portfolio named "Holdings on 9/99." CLICK OK on the Synchronize Portfolio Calculations.
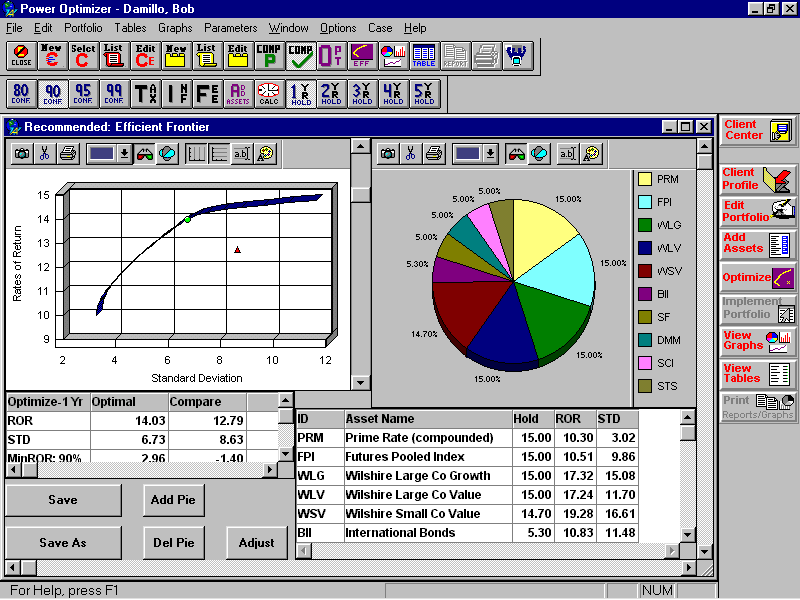
Note the red triangle below the efficient frontier. This represents the client’s current portfolio.
When you have decided on the portfolio to recommend, CLICK on the Save button at the bottom left corner. Note a portfolio that is northwest of the triangle will have higher return and lower risk than the current or comparison portfolio.
Implementing the Portfolio
Since we have created the portfolio using asset classes and indices, we will now make specific product recommendations for each asset class.
CLICK on the Implement Portfolio button on side tool bar. The screen showing displays the dollar amounts that are required in each asset category. To make a product recommendation for Specialty Financial Services, DOUBLE CLICK on it.
The Implement Asset Screen allows you to either type in the name of the investment your want to recommend or you can select the asset from the database. CLICK on the Select from List button at the bottom left corner.
Since Specialty Financial Services is a mutual fund index, Wilson has a link to all securities that have this as their class. Because this index is a mutual fund index, we will select Wilson Classified Securities and Mutual Funds.
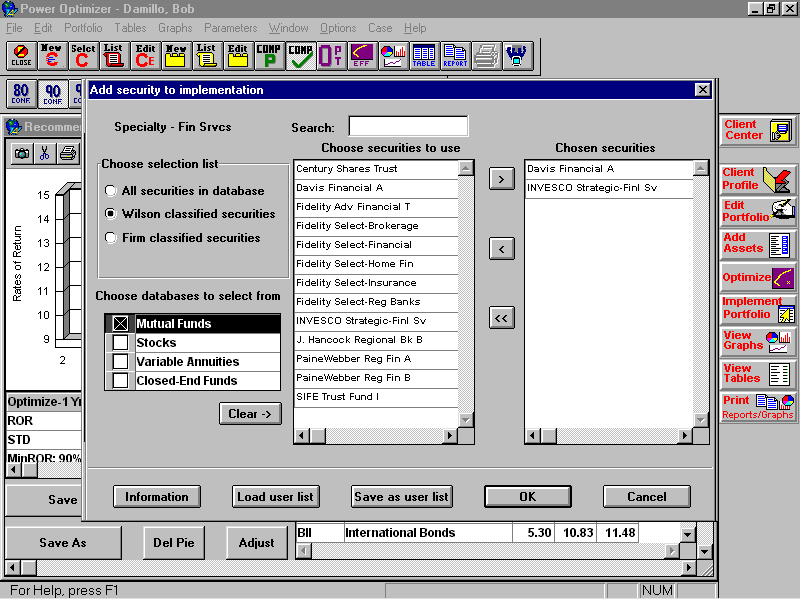
The list of funds displayed includes all Financial Services funds in the database. DOUBLE CLICK on Davis Financial and INVESCO Strategic Financial.
CLICK OK
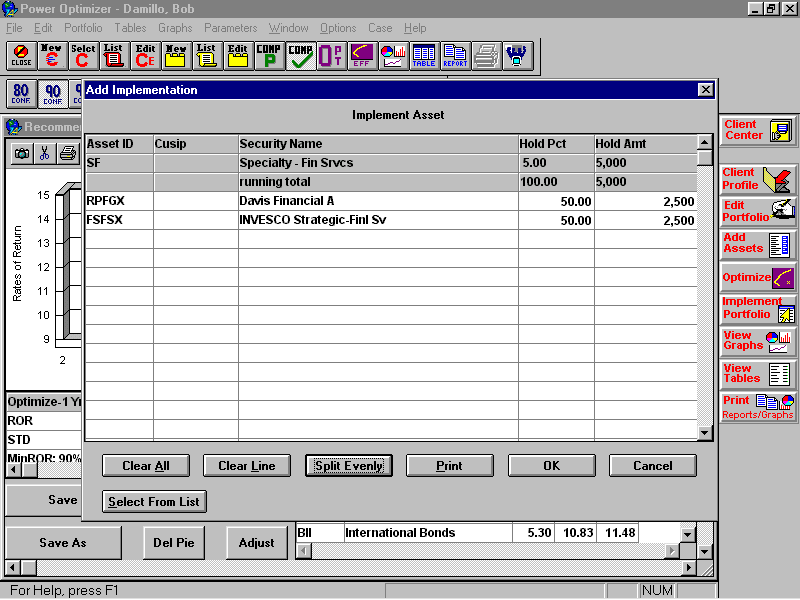
If you would like to invest equally in each of these funds, CLICK on the Split Evenly button. Otherwise, type in the Hold Percentage or the Hold Amount you would like to allocate to each fund.
CLICK OK
You have now made a specific security recommendation for Specialty Financial Services. At this point, you would continue to make security selections for each asset class.
CLICK OK
Viewing Graphs and Tables
To view graphs, CLICK on the View Graphs button on the side tool bar. Choose Asset Mix/Pie.
CLICK on View Graphs again. Choose Returns/Std Devs. Note the optional button at the bottom right corner. Try each of these now.
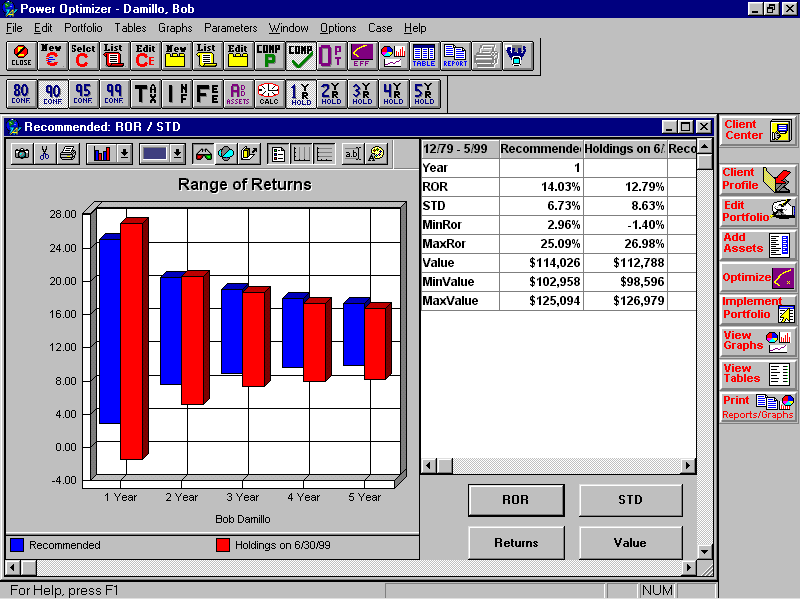
CLICK on the View Tables button and try several tables.
Printing Reports
Each of the graphs and tables can be printed individually or you can batch print them with boiler plate pages that include Cover Sheet, Cover Letter, Table of Contents, Blank Questionnaire and others.
To batch print, CLICK on the Print Reports/Graphs button on the side tool bar.
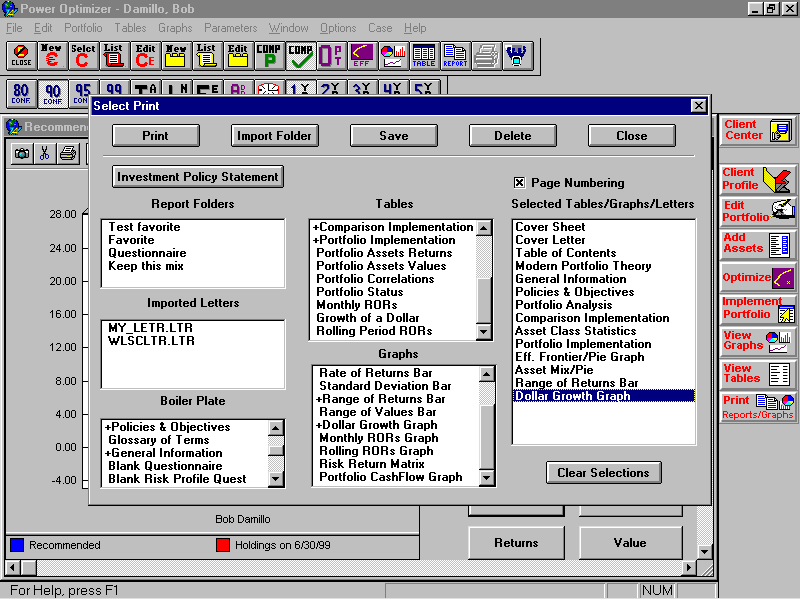
Select the Boiler Plate, Tables and Graphs that you would like to include in your Investment Presentation Report. Do this by DOUBLE CLICKing on the desired report(s). If you would like to change the order, you can Drag and Drop each report in the order you would like them to print.
If you would like to save a set of reports, CLICK on the Save button at the top after you have made your selections. This will produce a Report Folder that you can select the next time you are ready to print.
Conclusions
I hope this tutorial has been helpful to you. This tutorial only covered the basics of the Power Optimizer.
Keep in mind, you will most certainly have questions about several functions. Feel free to call Wilson Associates technical support at 818-999-0015 or send me an email at scott@software4advisors.com.
Good Luck,
Scott Abboud, CFP
800-831-7636
Copyright © T. Scott Abboud, CFP
